Site Search

Looking for something? Use the search bar below or visit our Resources page.


Author ALM First

Published

Estimated


Economic Update

  • An anxious tone persisted in risk markets throughout March, keeping equity market implied volatility elevated above the post-crisis average
  • Concerns related to inflation pressures and tighter monetary policy shifted to threats of a potential trade war
  • As expected, the FOMC raised the fed funds rate by 25 bps at its March 21 meeting, but its projections for further rate hikes in 2018 were less hawkish than some anticipated

The anxious tone that emerged in risk markets in early February remained for much of March. Domestic equity markets declined approximately 3% in the prior month, and the VIX Index (S&P 500 implied volatility) traded above its post-crisis average for 70% of the trading days in March. The rise in intermediate and long-end rates also took pause, with the 10-year Treasury yield ending the month 12 basis points (bps) lower. Rising inflation expectations and long-end rates were significant catalysts for the February sell-off in equities, but concerns of a pending trade war captured the attention of market participants in recent weeks.

On March 1, President Trump announced his administration would impose tariffs on steel and aluminum imports, which would make good on campaign promises he had previously made. Perhaps more importantly, the White House made clear that there would be no exemptions allowed for U.S. allies. Not surprisingly, equity markets responded negatively to such threats, even if the direct economic impact of steel/aluminum tariffs were relatively limited. The greater risk of such measures is the unknown retaliatory measures from other nations, which could spiral into outright trade wars (inflationary and negative for global growth). In fact, European Union officials quickly threatened retaliatory measures against U.S. exports, including Harley-Davidson, Levi Strauss and bourbon. It’s not likely a coincidence that those companies happen to be domiciled in the congressional districts of House Majority Leader Paul Ryan, Senate Majority Leader Mitch McConnell, and House Minority Leader Nancy Pelosi.

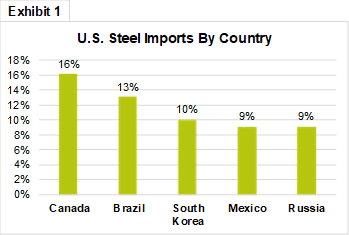
As Exhibit 1 illustrates, many of the top steel exporters to the United States are considered allies (aluminum exporters are similar), and the country notably absent from this list is China, with which the United States has the largest trade deficit (and contentious trading relationship). China has been presumed to be the real target of U.S. trade restrictions, and the United States had already imposed hefty tariffs on Chinse steel, which effectively drove those exports into other markets (and still lowered the price of global steel). By offering no exemptions on the U.S. tariffs, the White House is effectively forcing its allies to enforce similar measures on China, and according to recent reports, the Trump administration has expressed a willingness to soften its stance with allies to help crack down on Chinese trade practices. As such, the White House’s motives are presumed to be well beyond steel/aluminum and much more focused on intellectual property theft and technology transfer. On March 22, the administration announced $50 billion of new tariffs on Chinese products where this issue is most prevalent. In the days before the announcement, Chinese Premier Li Keqiang promised that his government will take efforts to protect intellectual property of foreign investors, and despite the announced tariffs from both the U.S. and China, the overall rhetoric has softened somewhat in recent days.

An all-out trade war would likely be negative for stocks and bonds (growth and inflation implications), and a reduced trade deficit for the United States would also have consequences for domestic asset valuations. In short, a trade deficit corresponds with a current account surplus. In other words, the United States pays dollars for goods, which must either be exchanged for other currencies or invested in U.S. assets. This includes both hard assets (real estate, etc.) and securities. China invests most of its U.S. dollars in U.S. Treasuries (~$1.2 trillion), as well as agency MBS and stocks (~$200 billion each). If China “loses” the trade war and the imbalance is lessened, its portfolio of U.S. assets would shrink as well. In addition to inflation and U.S. budget deficit concerns (via tax reform and increased spending), there would likely be further upward pressure on long-end Treasury yields in this scenario.

Fed Policy

As widely expected, the FOMC raised the fed funds rate by another 25 bps at its March 21 meeting. The official statement maintained a positive outlook for growth and inflation. Market participants were most focused on the updated forecasts of FOMC participants for growth, unemployment, inflation, and the fed funds rate (mostly the latter). Given hawkish comments from new Fed Chair Jerome Powell during his February Congressional testimony, investors were preparing for 2018 projected rate hikes to increase to four. However, the median forecast for 2018 was unchanged from December at three hikes, and one additional 25 bps hike is forecast for 2019. The market was already priced for three hikes in 2018, so there was little impact on market rates following the announcement.

The Fed’s forecasts for GDP and unemployment were improved for both 2018 and 2019, but inflation expectations over the same timeframe were essentially unchanged. This implies a couple of things: one, the increased GDP growth forecast is likely tied to fiscal stimulus, which the Fed doesn’t feel will spill over into price inflation; and two, the fact that the unemployment rate forecast was lowered without increased inflation expectations implies that the Fed has once again lowered its NAIRU assumption (non-accelerated inflation rate of unemployment). NAIRU is effectively a breakeven rate of unemployment relative to inflation, and many economists have questioned the reliability of this measure, which is closely associated with Phillips curve economic theory (i.e., inverse relationship between unemployment rate and wage/price inflation).


To continue reading this month’s market commentary, and to learn more about current market themes, market sectors, sector performances, and applied strategies, log in to the ALM First portal, and select this month’s commentary in the Resource Center.

ALM First

ALM First was founded in 1995 with the focus on financial advisory services for credit union clients.

LinkedIn

  Commentary Disclaimer

ALM First Financial Advisors is an SEC registered investment advisor with a fiduciary duty that requires it to act in the best interests of clients and to place the interests of clients before its own; however, registration as an investment advisor does not imply any level of skill or training. ALM First Financial Advisors, LLC (“ALM First Financial Advisors”), an affiliate of ALM First Group, LLC (“ALM First”), is a separate entity and all investment decisions are made independently by the asset managers at ALM First Financial Advisors. Access to ALM First Financial Advisors is only available to clients pursuant to an Investment Advisory Agreement and acceptance of ALM First Financial Advisors\' Brochure. You are encouraged to read these documents carefully. All investments involve risk and may lose money.

The content in this article is provided for informational purposes and should not be relied upon as recommendations or financial planning advice. We encourage you to seek personalized advice from qualified professionals regarding all personal finance issues. While such information is believed to be reliable, no representation or warranty is made concerning the accuracy of any information presented. Statements herein that reflect projections or expectations of future financial or economic performance are forward-looking statements. Such “forward-looking” statements are based on various assumptions, which assumptions may not prove to be correct. Accordingly, there can be no assurance that such assumptions and statements will accurately predict future events or actual performance. No representation or warranty can be given that the estimates, opinions or assumptions made herein will prove to be accurate. Actual results for any period may or may not approximate such forward-looking statements. No representations or warranties whatsoever are made by ALM First Financial Advisors as to the future profitability of investments recommended by ALM First Financial Advisors.

Moreover, this report was prepared as of the date indicated herein. No representation or warranty is made by ALM First that any of the returns or financial metrics detailed herein will be achieved in the future, as past performance is not a reliable indicator of future results. Certain assumptions may have been made in preparing this material that have resulted in the returns and financial metrics detailed herein. Changes to the assumptions may have a material impact on any returns or financial metrics herein. Furthermore, ALM First gives no representation, warranty or undertaking, or accepts any liability, as to the accuracy or completeness of the information contained this report. This report was prepared for informational purposes only without regard to any particular user’s investment objectives, financial situation, or means, and ALM First is not soliciting any action based upon it. This material is not intended as, nor should it be construed in any way as accounting, tax, legal, or investment advice including within the meaning of Section 975 of the Dodd-Frank Wall Street Reform and Consumer Protection Act. Certain transactions give rise to substantial risk and are not suitable for all investors. The strategies discussed herein can have volatile performance and may employ leverage. Moreover, investment advisory fees and expenses may offset trading gains. This report was prepared by ALM First Financial Advisors, LLC. The hereto mentioned report contains information which is confidential and may also be privileged. It is for the exclusive use of the intended recipient(s). If you are not the intended recipient(s), please note that any distribution, copying, or use of this report or the information contained herein is strictly prohibited. If you have received this report in error, please notify the sender immediately and then destroy any copies of it. ALM First neither owes nor accepts any duty or responsibility to the unauthorized reader. ALM First shall not be liable in respect of any loss, damage, or expense of whatsoever nature which is caused by any use the unauthorized reader may choose to make of this report, or which is otherwise a result of gaining access to the report by the unauthorized reader. This content contains information derived from third-party sources. We believe that this third-party data is reliable; however, we cannot guarantee this data’s currency, accuracy, timeliness, completeness, or fitness for any particular purpose.

INDEX BENCHMARKS: Index performance is discussed for illustrative purposes only as a benchmark for each strategy’s performance and does not predict or depict performance of that strategy. While index comparisons may be useful to provide a benchmark for a strategy’s performance, it must be noted that investments are not limited to the investments comprising the indices. Each of the strategy benchmark indices are unmanaged and cannot be purchased directly by investors.

HYPOTHETICAL PERFORMANCE DISCLAIMERS: Performance figures derived from model portfolios are hypothetical in nature and the results of any individual investor will differ as a result of various factors, including investment limitations relative to model portfolio guidelines, availability of same or similar assets, and fee structures. Investments are presumed to have been made at the beginning of the time period and there are no inflows or outflows of cash during the period. There are limitations and risks associated with the use of model performance or hypothetical performance information, and you should be cautious when looking at any presentation of model or hypothetical performance information. Investment strategies should not be based solely on the use of model or hypothetical information. Actual results will be different from those shown in model or hypothetical performance. The model portfolio returns reflect actual trading including the reinvestment of coupon payments and are net of transaction costs, administrative costs and a strategy-specific per annum fee ranging from 5 bps to 50 bps, which is the amount of the highest fee charged to any ALM First Financial Advisors, LLC customer employing that particular strategy during the period under consideration (the “Model Fee”). Actual fees will vary depending on, among other things, the applicable fee schedule and portfolio size. ALM First\'s fees are available upon request and also may be found in its Form ADV Part 2A. Past performance does not guarantee future results.


Strategic Partners

Let’s Work Together

ALM First is your agile partner with a trusted history of delivering results.
