A U.S. default appears to have been averted, but obstacles remain for financial markets
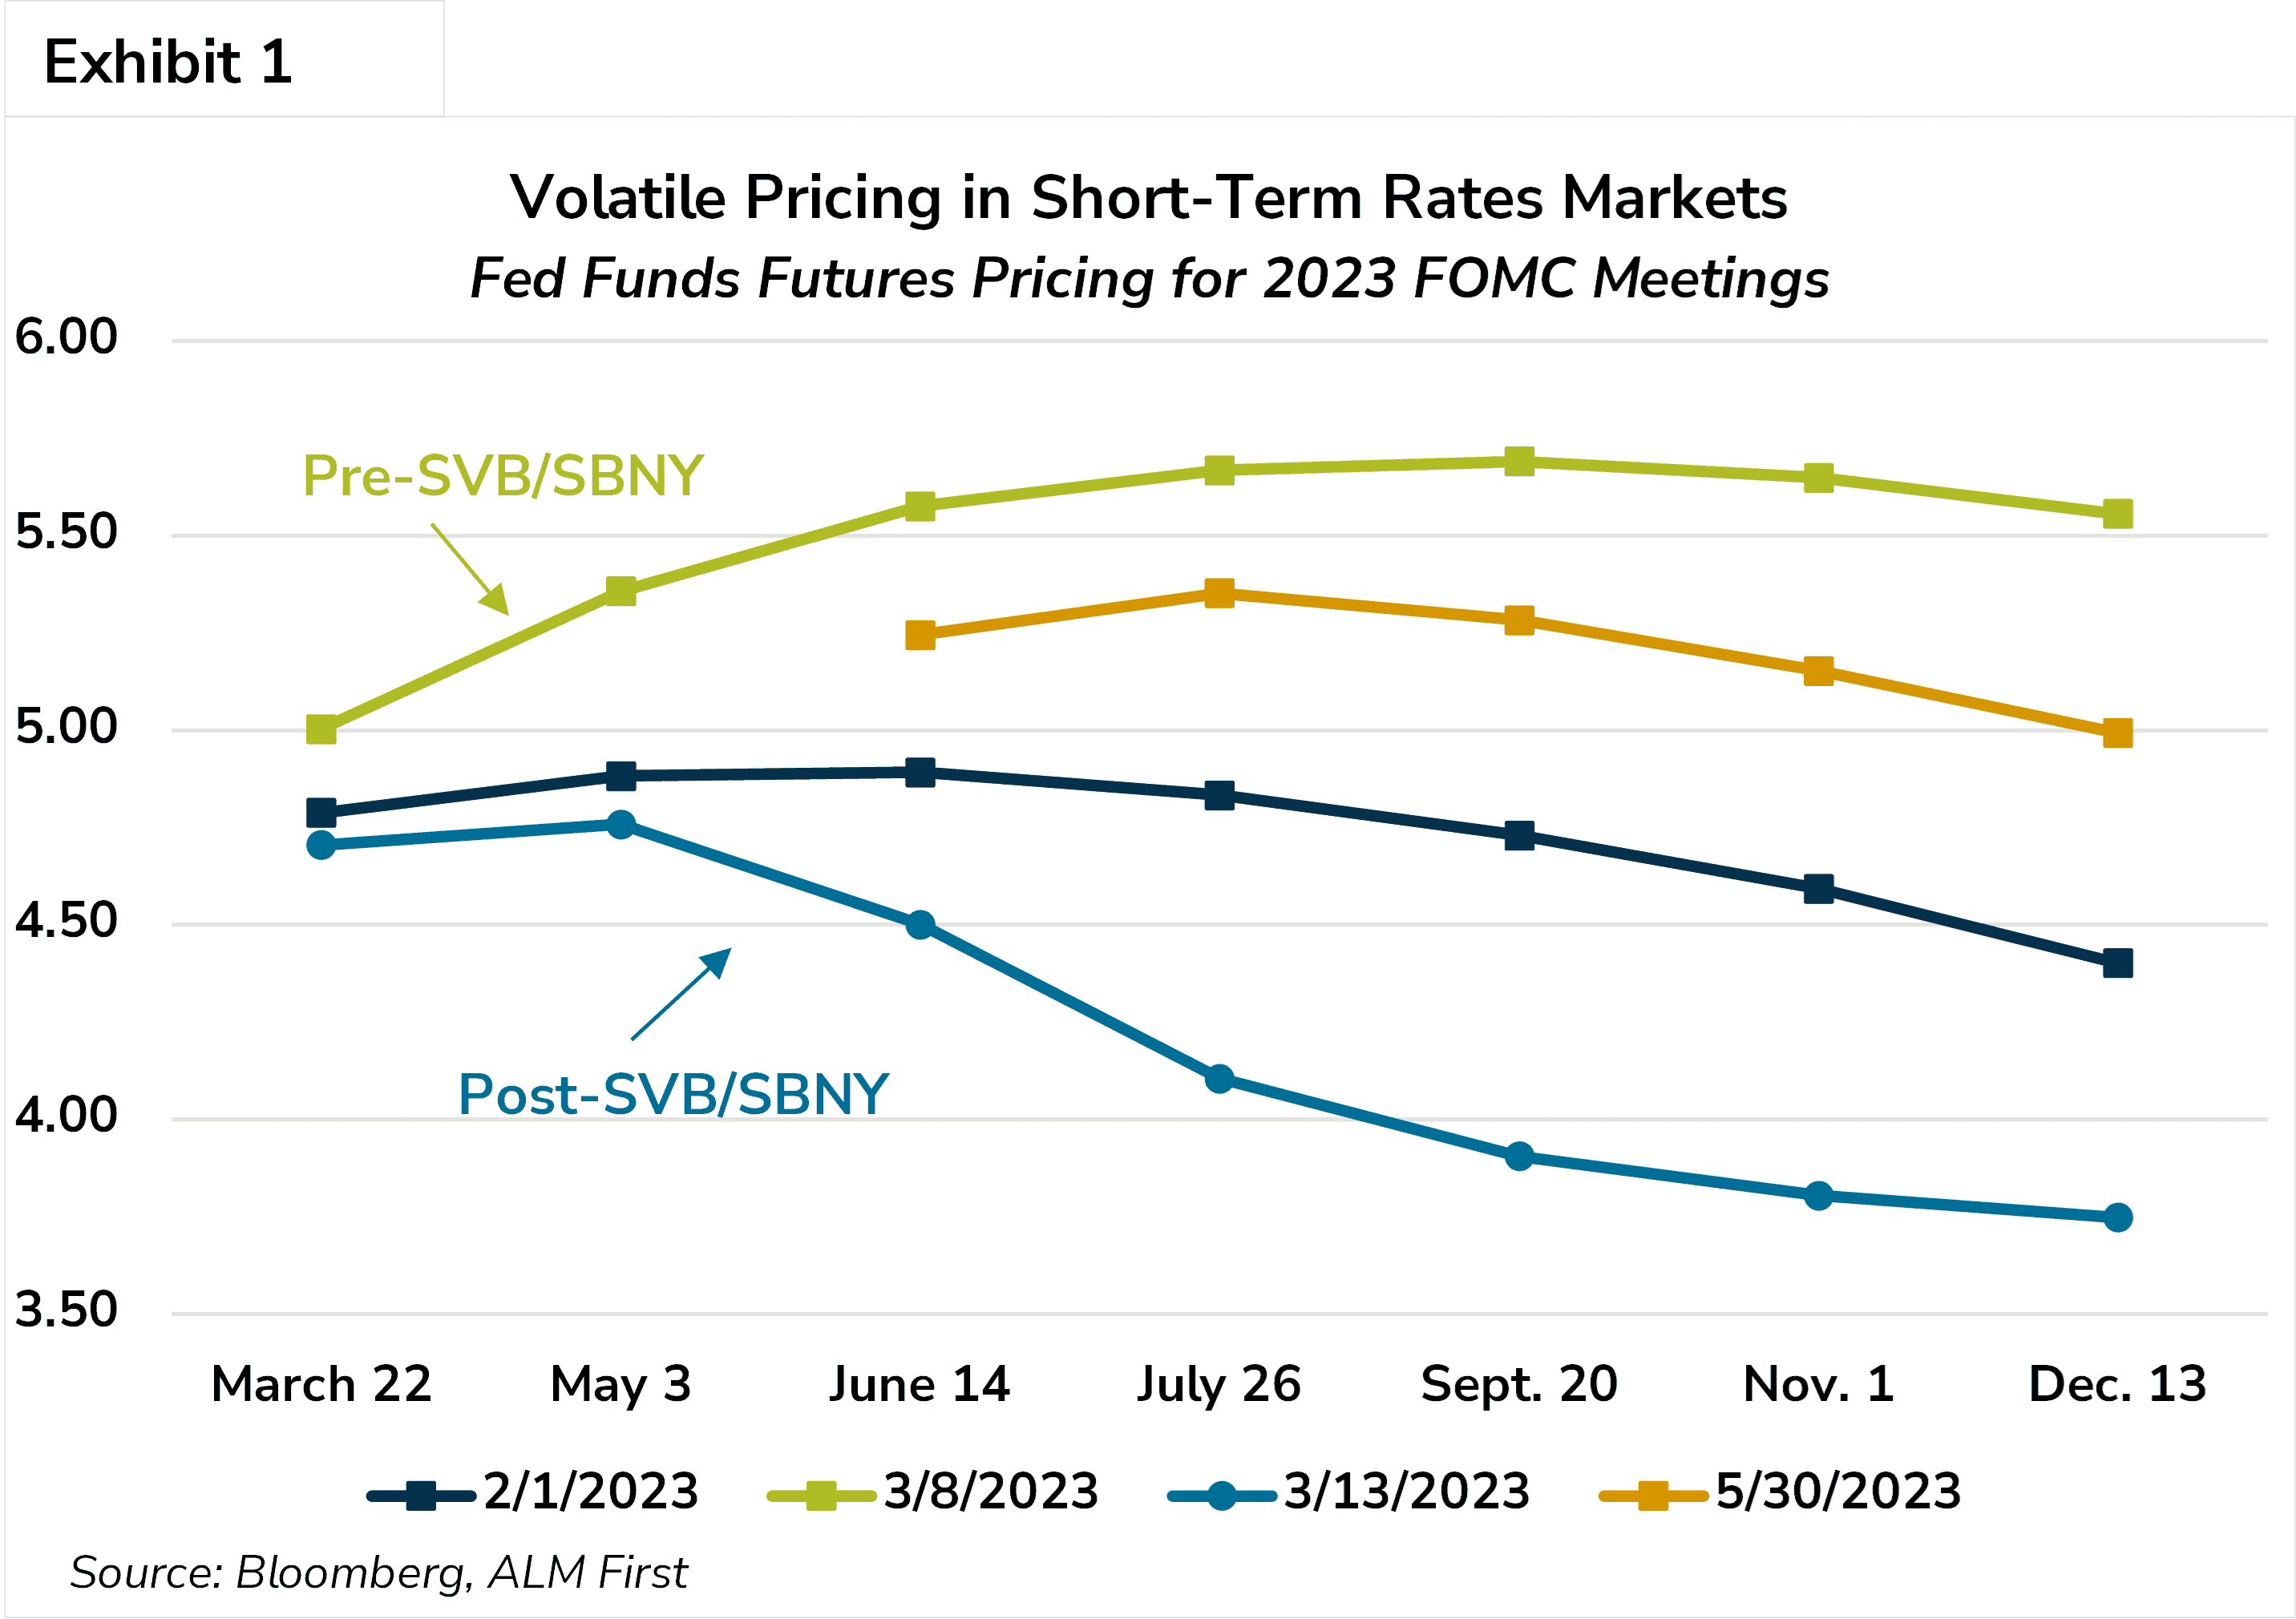
Market pricing for Fed interest rate policy has been volatile in 2023, and May was no different
In reviewing industry data following the March bank failures, we have found many institutions with bond portfolios that exhibit atypical interest rate risk profiles
As we begin the month of June, it appears that one manufactured crisis has been averted—the U.S. debt ceiling standoff. At the time of writing, the House had passed a debt ceiling bill by a wide margin (314-117), and the Senate was widely expected to comfortably pass the legislation by Saturday, June 3, at the latest, avoiding a default early the next week. That would clear one major obstacle, but there is no ‘all clear’ signal just yet for financial markets. It remains uncertain whether the Fed is done with the current rate hike regimen, not to mention questions of how long monetary policy will have to remain tight. As such, market pricing for Fed policy has been very volatile so far this year, as illustrated in Exhibit 1. As recent as May 11, fed funds futures were pricing for no additional rate hikes and 75 basis points (bps) of rate cuts by year-end. As of May 30, market pricing has moved closer to where we were prior to the March bank failures.
A prolonged Fed tightening effort coupled with elevated rate volatility fosters risks of another ‘break’ in one or more market sectors. It also presents risks to a sector already under stress – U.S. depository institutions. There have been no new failures of consequence since First Republic was shuttered on May 1, but stock prices of some other mid-size/large regional banks remain under pressure (PacWest, Western Alliance, etc.). Fed officials have expressed concerns that tighter credit in the wake of the recent bank failures is “likely to weigh on economic activity, hiring, and inflation,” but they have also acknowledged limitations in their abilities to forecast the severity of that impact. In the meantime, the unemployment rate reached a new cycle low in April, and core inflation rates remain well above the Fed’s 2% target. Some of the most influential Fed leaders, including Chair Jerome Powell, have signaled in recent weeks an openness to pausing at the June 14 meeting to give time to assess the cumulative impact of rate hikes to date, as well as the potential impact of tighter bank credit.
What We’ve Learned Post-SVB
Nearly three months have passed since SVB was closed by regulators, and in that timeframe, our eyes have been opened to several other examples of poor risk management in the banking industry, particularly in bond portfolios. These portfolios should be built to complement overall balance sheet risk and have nothing to do with opinions on the future path of interest rates. The latter appears to have been a primary source of folly for SVB. In his written testimony before the Senate banking committee on May 16, former SVB CEO Greg Becker made a curious statement in defense of the bank’s risk positioning. “Importantly, throughout 2020 until late 2021, the messaging from the Federal Reserve was that interest rates would remain low and that the inflation that was starting to bubble up would only be ‘transitory,’” said Becker. As any veteran capital markets or banking professional understands, “because the Fed said so” is not a viable defense for poor discipline and risk management.
In reviewing several portfolios and industry call report data in the wake of the March bank failures, we have been surprised to see the risks taken by some depository portfolio managers relative to what you would traditionally see for the typical bank or credit union portfolio. We found portfolios with concentrated fixed-rate bond allocations and portfolio effective durations well north of 5%. Rarely did we find allocations to floating-rate securities, which, in addition to providing an interest-rate risk offset to the longer fixed-rate positions, are also one of the only sectors in the high credit quality fixed income space with a negative correlation when analyzing historical returns. We also found these portfolios do not utilize interest rate swaps or other derivatives to reduce overall portfolio duration.
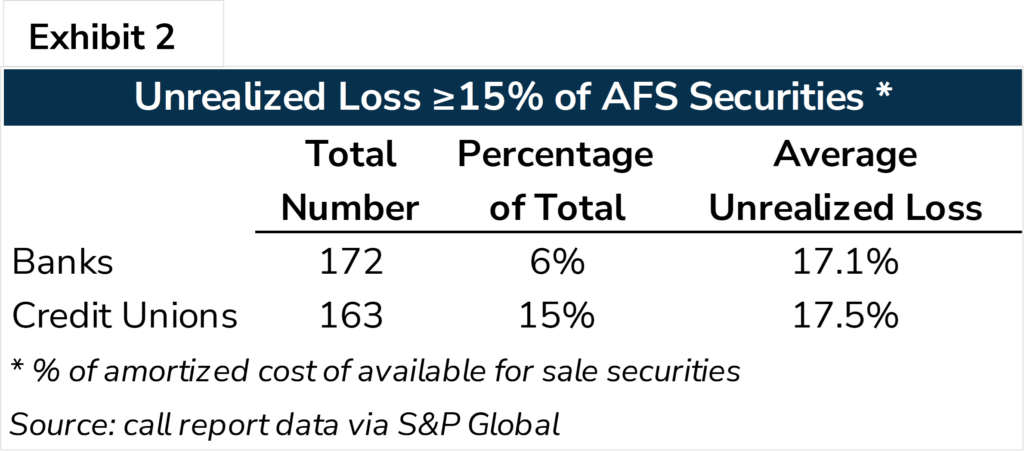
In Exhibit 2, we show Q1 call report data for banks and credit unions with total assets between $250 million and $50 billion, and we evaluate unrealized losses on available for sale (AFS) bond portfolios as a percentage of the total portfolio. For banks, there were 172 institutions, or 6% of the total, with unrealized losses of 15% or more of the total portfolio. For credit unions, there were 163 such institutions, which accounted for a larger 15% share of the credit union list. Given the change in Treasury yields since the end of 2020, this would imply portfolio effective durations of more than 5% for these institutions. The primary question is whether this interest-rate risk profile was intentional.
In our experience as asset liability management (ALM) consultants and fixed income portfolio managers, the typical depository portfolio effective duration is 3% or less (unhedged), unless there are special circumstances related to a specific institution’s funding and asset mix. Some of the institutions represented in Exhibit 2 could fall into this category, and as such, a longer portfolio duration was no accident. However, in reviewing the asset mix of other portfolios in recent weeks, we wonder if those investors truly understood the risk profile of the underlying assets, particularly those assets with embedded options.
To download this economic update portion of our Monthly Market Commentary, please click here.
To continue reading the full month’s market commentary, and to learn more about current market themes, market sectors, sector performances, and applied strategies, log in to the ALM First portal, and select this month’s commentary in the Resource Center. If you do not have a login and you would still like to access the document, please send your inquiry to info@almfirst.com.