
Economic Update
- The FOMC announced a fourth consecutive 75 basis point (bp) rate hike at the November 2 meeting but opened the door for slowing the pace of hikes at future meetings
- There have been positive signs of slowing demand and easing supply disruptions, but inflation and labor market data remain too hot for the Fed to consider a “pivot” at this point
- The sharp rise in benchmark yields and widening of spreads have made near-term expected returns in high credit quality fixed income as attractive as we’ve seen in well over a decade
We are quickly approaching the end of what has been a tumultuous year for financial markets. Both economic and monetary policy uncertainty remain high, and the Fed just moved forward with a fourth consecutive 75 basis point rate hike at the November 2 FOMC meeting. This marks 375 bps of rate hikes in less than 4 months, with more presumably to come. However, the Committee did open the door for a slowdown in the pace of future rate hikes. While not completely unexpected on that front, Chair Powell made it clear that a pause in rate hikes is not under consideration at this point.
The price action in financial markets remained volatile in recent weeks. On October 21, Fed watcher Nick Timiraos of the Wall Street Journal kickstarted a rally in front-end Treasury yields when he penned an article titled “Fed Set to Raise Rates by 0.75 Point and Debate Size of Future Hikes.” The 5-year Treasury yield proceeded to fall nearly 40 bps in the next five trading sessions, only to reverse course again following better-than-expected economic data and a seemingly-contradictory follow-up article by Timiraos on 10/30. Timiraos’ second article was titled “Cash-Rich Consumers Could Mean Higher Interest Rates for Longer,” which falls more in line with what Jerome Powell has been stating for several months now. Exhibit 1 provides a refresh on household liquid assets (checking, savings, and money market funds) using Fed data through Q2.
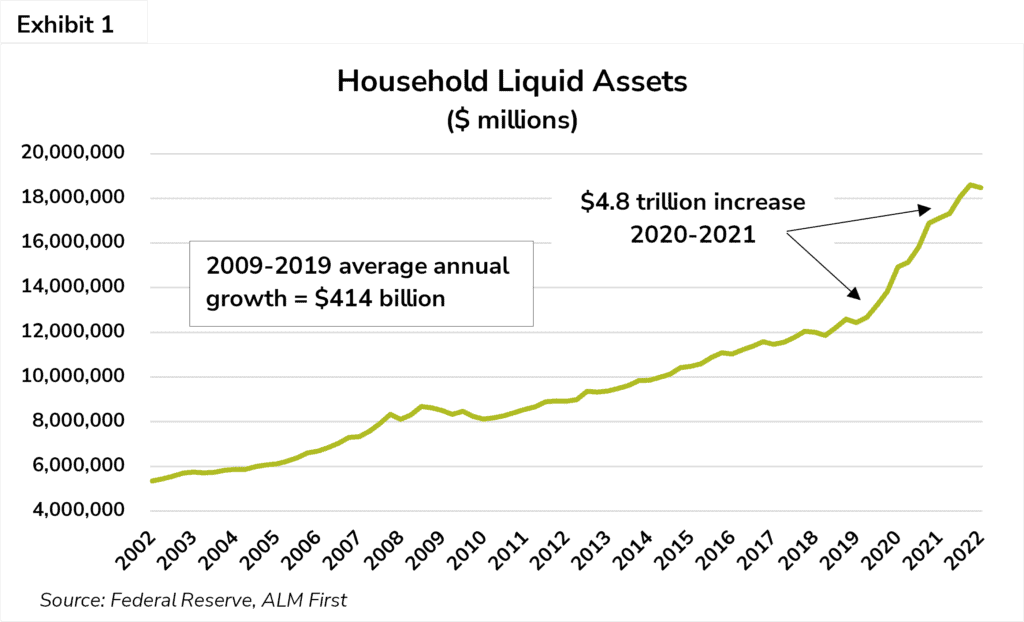
This chart was last shown in our June commentary, highlighting the clear surge during the peak pandemic years. While the personal savings rate has fallen to 3.1% (lowest since 2008), that rate doesn’t reflect the enlarged stimulus-driven savings that increased the base level, effectively countering the Fed’s efforts against inflation.
There are some positive signs that we may be closer to the end of hawkish central bank policies, but it is still premature to speculate on that front, particularly with household balance sheets still holding a unusually high amount of excess savings thanks to pandemic-related monetary and fiscal stimulus. To be sure, there are signs that personal consumption is slowing, as evidenced in part by the Q3 GDP report. Wage growth, as measured by the Employment Cost Index slowed to 1.2% q/q in Q3, down from 1.4% in Q1 and 1.3% in Q2, but it still remains at a historically high level. The labor market simply remains stubbornly resilient. The JOLTS report for September showed job openings unexpectedly bouncing higher to 10.72 million versus expectations of a decline to 9.75 million. As a result, the ratio of job openings to total unemployed persons rose from 1.7:1 to 1.9:1, just 1/10th below the cycle high. This is a metric Fed Chair Powell has discussed publicly many times this year as a sign of an “unhealthy” labor market. That said, Fed leaders may very well be contemplating a slowdown in the pace of rate hikes in the coming months, but they must be careful with any external discussion of a near-term “pivot,” otherwise they risk the market rallying and easing some of the tightening of financial conditions necessary to bring inflation down. It’s a difficult tightrope to walk, but the growing consensus in the bond market in recent weeks is that we have surpassed peak hawkishness by the Fed and other major central banks.
Opportunities in the Current Market
It has been a dreadful year for virtually every financial asset except for the U.S. dollar. For broad fixed income, the ICE BofA US Broad Market Index generated a -15.85% total return for 2022 through October, the worst 10-month return since the index was created in January 1976. For added perspective, the second worst 10-month return was the period ending March 1980 at -10.34%. Rates have moved sharply higher and spreads significantly wider, and historically-high implied interest rate volatility has contributed to the highest compensation for option risk in new production mortgage-backed securities (MBS) since the Great Financial Crisis (GFC). In Exhibit 2, we perform a 12-month expected return analysis for a simple mix of Agency MBS, Agency CMBS, and agency floating-rate securities (no credit risk in the portfolio).
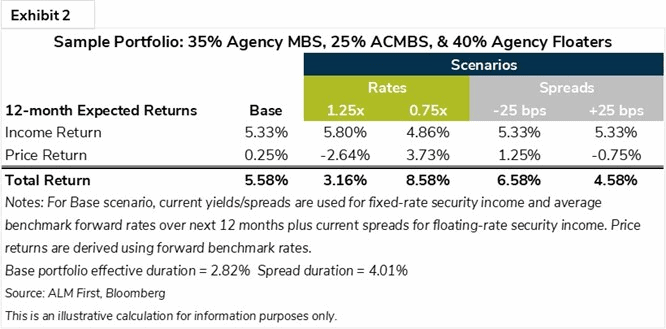
The analysis utilizes current benchmark rates and spreads for portfolio assets, as well as forward benchmark rates over the next 12 months. The base scenario income return is expected to be 5.33% using the sample allocation mix, and a slightly positive price return given a modest decline in duration-matched benchmark rates over the next year. If we observe historical returns for the ICE BofA 1-5yr Broad Market Index, one has to go back to 2007 for the last time a calendar-year income return surpassed 5%. The average income return for this index since inception in 1998 was 3.65% through the end of 2021. With that perspective in mind, we understand that strong portfolio performance isn’t dependent upon rates falling and/or spreads tightening. Current yields/spreads are already very attractive on a historical basis.
The 0.75x Rates scenario assumes that actual rates evolve at only 75% of what is currently priced in, which would be positive for the portfolio’s price, but income would be nearly 50 bps lower due entirely to lower yields for floating-rate securities relative to base expectations. Vice versa for 125x Rates. The spread scenarios do not impact income return, but price returns are impacted based on portfolio spread duration. Could rates and spreads move higher from current levels? Certainly, but it is important to understand what is currently priced into the market, including a 5% terminal fed funds rate in March 2023 and sector spreads at multiple standard deviations above historical averages. For institutions with limited liquidity but excess capital beyond what is needed to cover unexpected losses, credit-related or otherwise, utilizing non-core funding sources is a viable consideration. If using short-term borrowing options, future economic gains can be further protected with interest-rate derivatives.
To continue reading this month’s market commentary, and to learn more about current market themes, market sectors, sector performances, and applied strategies, log in to the ALM First portal, and select this month’s commentary in the Resource Center. If you do not have a log in and you would still like to access the document, please send your inquiry to info@almfirst.com.
