Site Search

Looking for something? Use the search bar below or visit our Resources page.


Author ALM First

Published

Subject

Estimated


Economic Update

  • Technical factors have contributed to higher real yields in multiple large fixed income markets in recent months
  • Housing affordability is the worst it has been in decades amid a sharp rise in mortgage rates and sticky home prices
  • Liquidity has tightened notably over the last year for financial institutions, and the outflow of core deposits has coincided with nearly the same amount of inflows for time deposits and money market fund balances

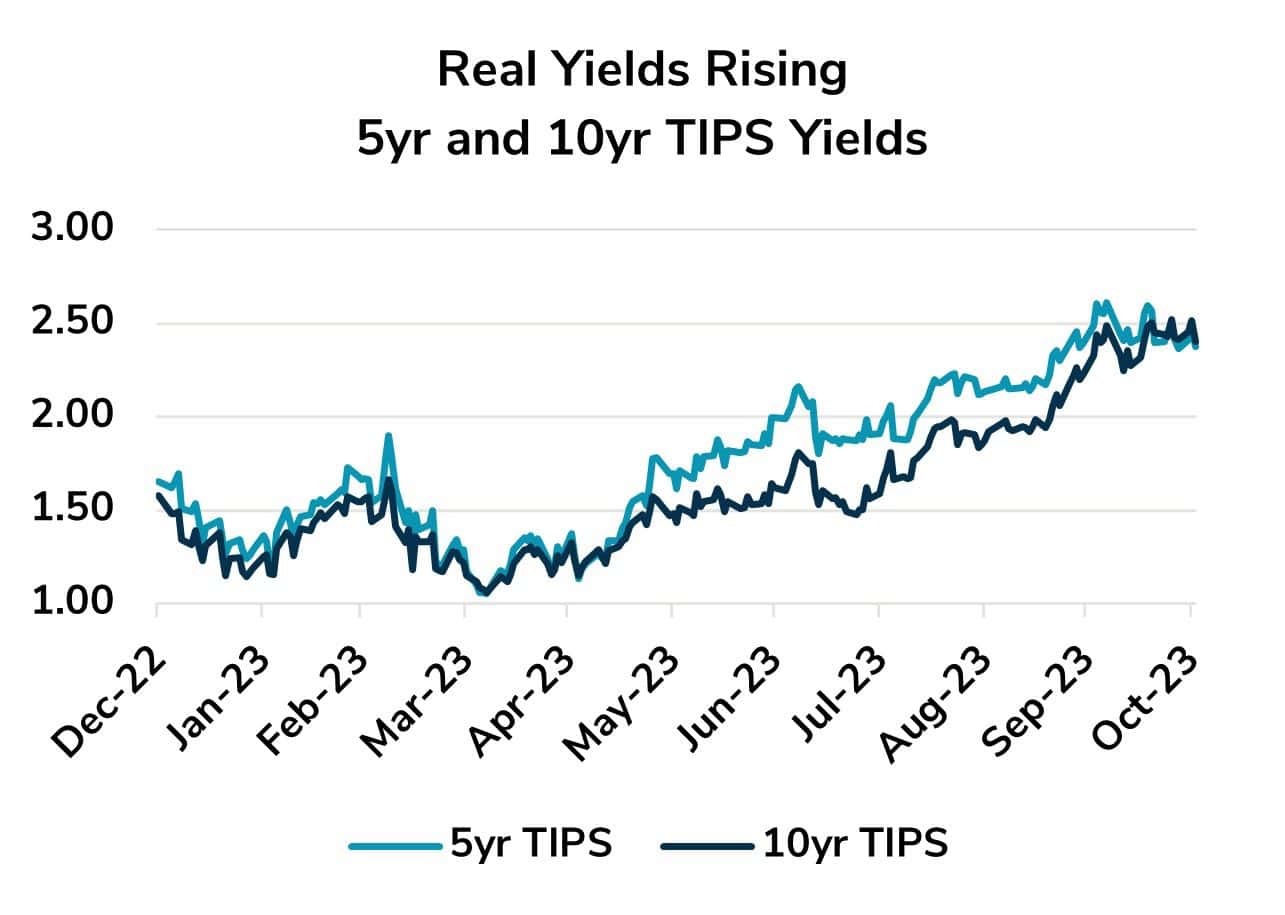
Technical factors have overwhelmed fundamentals in multiple corners of the bond market as 2023 has progressed. This phenomenon is perhaps most visible in the $25 trillion U.S. Treasury securities market. Supply and demand imbalances have helped fuel a surge in intermediate and long-end yields over the last several months. Some of the move can be attributed to an improved economic outlook feeding the ‘higher for longer’ narrative, but real, or inflation-adjusted, yields are up sharply over the last several months as well. Exhibit 1 tracks 5-year and 10-year Treasury Inflation Protected Securities (TIPS) yields so far this year, and while some critics argue that the TIPS market doesn’t fully or accurately capture market inflation expectations, yields have clearly risen beyond what can be explained by a higher forward path of short-term rates after the regional bank scare last Spring. This has coincided with a significant increase in Treasury funding needs (supply), driven by both increased budget deficits and the Fed’s Quantitative Tightening (QT) efforts, the latter of which is effectively adding more than $700 billion per year to the supply/demand imbalance. A popular explanation for the recent sell-off in long-end Treasury yields is expectations for a higher and more persistent fiscal budget deficit. Some have suggested a return of the ‘bond vigilantes’ made famous in the 1990s during the Clinton administration.

Exhibit 1

Source: Bloomberg

A technical imbalance exists in another large sector – Agency MBS. For the last 15 years, the largest sponsors of this asset class have been the Fed and financial institutions. Both buying segments have been sidelined for the last 18 months for differing reasons. While this is not the only reason for spread widening over that timeframe (surging interest rate volatility has been a prime contributor), other investors (e.g., money managers) haven’t been able to pick up the slack even while shifting to overweight MBS positions in recent months. This could limit future spread tightening if QT and current liquidity conditions for financial institutions persist. However, current valuations and yield carry remain very attractive on a historical basis, more specifically for current/recent production coupons.

Housing Affordability (or lack thereof)

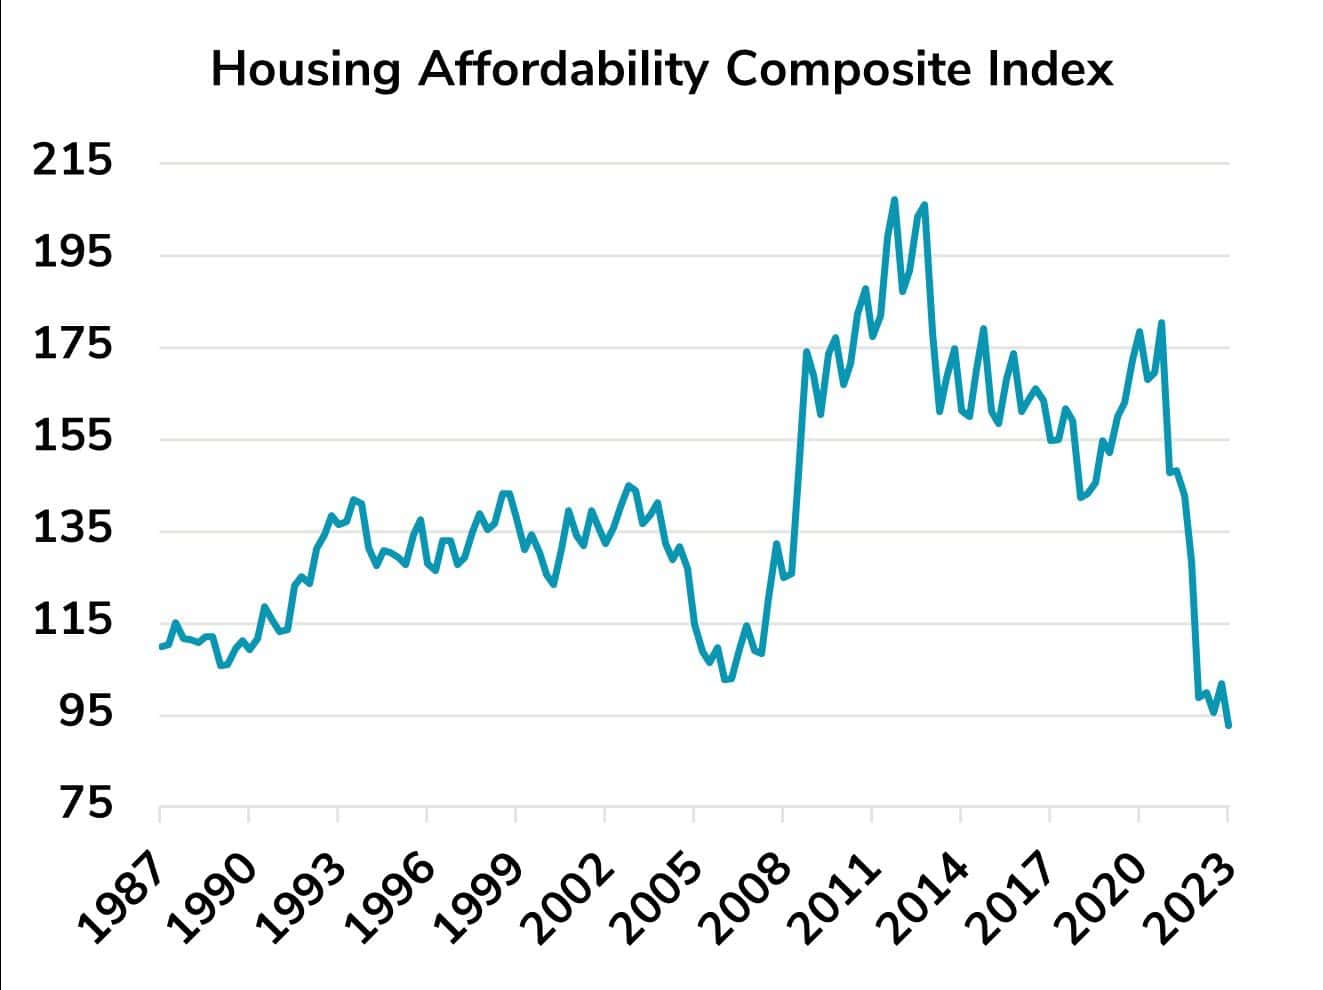
The selloff in long-end yields over the last six months has pushed mortgage rates north of 8% for the first time since 2000 according to BankRate’s national average of 30-year conventional loans. With home prices remaining stubbornly high, thanks in large part to a dearth of supply, housing affordability measures are the worst we’ve seen in many years. Exhibit 2 tracks the National Association of Realtors’ housing affordability composite index, which began in Q1 1986. The most recent release as of Q2 was at the lowest level on record, and with mortgage rates continuing to rise in Q3, affordability has only worsened.

Exhibit 2

Source: National Association of Realtors, Bloomberg

A recent Wall Street Journal article highlighted an analysis from commercial real estate firm CBRE showing the growing gap between the average monthly mortgage payment at current rates relative to the average apartment rent. The former is now 52% higher than the latter, by far the highest since CBRE began tracking the data in 1996. The previous high for this premium, which was negative for most of the post-crisis era, was 33% in the second quarter of 2006. On a positive note, 82% of all homeowners with a mortgage have a rate below 5%, and 62% have a rate below 4%, according to Redfin. Considering that mortgages are the largest liability for most U.S. households, it has been a major source of strength for consumer balance sheets, even if current rates are restrictive for new homeowners (and housing turnover/supply).

Where Have All the Deposits Gone?

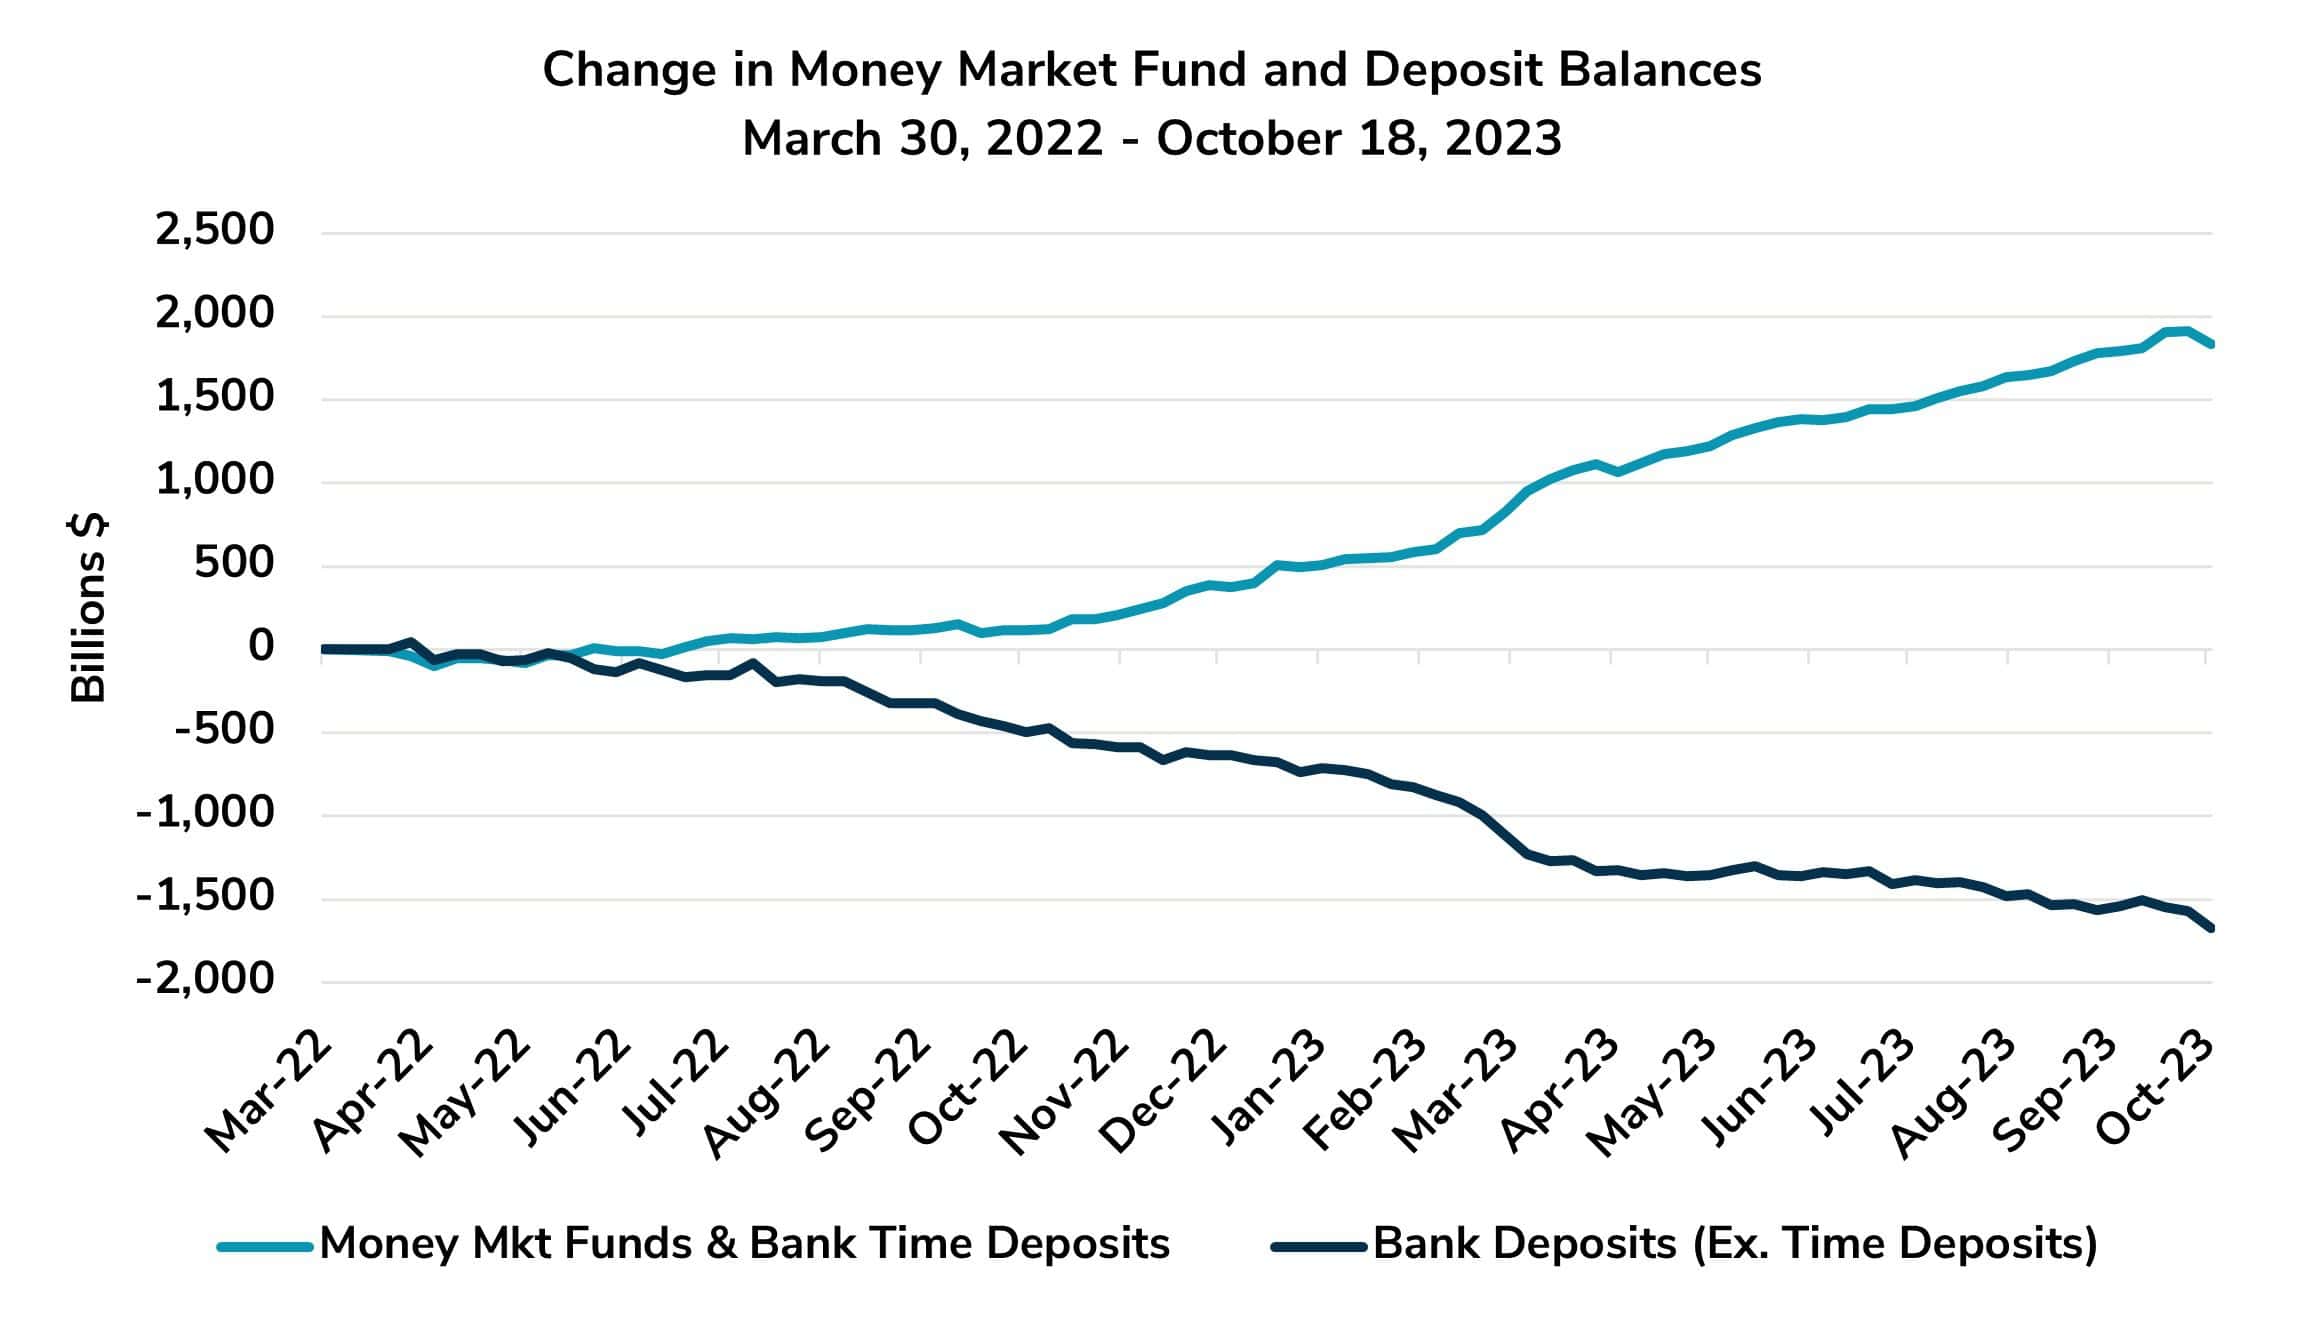
The banking industry has faced numerous challenges over the last few years, particularly amid the Fed’s extraordinary tightening campaign of the last 18 months. After a surging inflow of liquidity during the pandemic, core deposits, in aggregate, have turned the other direction, creating liquidity challenges for the industry. Exhibit 3 provides a simple, but telling, illustration of where those deposits have migrated. Beginning in March 2022, the chart tracks changes in total money market fund balances plus bank time deposits, compared to the change in bank deposits (excluding time deposits). From 3/30/2022-10/18/2023, the former category rose $1.84 trillion while the latter fell $1.67 trillion. For much of the post-GFC era, financial institutions relied on an ever-rising and historically-high level of non-maturity deposits, with little demand for money market funds and CDs. This coincided with short-term rates near the zero bound and Fed quantitative easing for much of that period. However, institutions are now grappling with an outflow of lower-cost core deposits and the prospect of that trend continuing for the near/intermediate future. To maintain profitability in such an environment, asset pricing, capital allocation, hedging, etc. remain critical areas of focus for the banking industry going forward.

Exhibit 3

Source: Federal Reserve H.8; Santander Capital Markets; ALM First


To download this economic update portion of our Monthly Market Commentary, click here.

To continue reading the full month’s market commentary, and to learn more about current market themes, market sectors, sector performances, and applied strategies, log in to the ALM First portal, and select this month’s commentary in the Resource Center. If you do not have a login and you would still like to access the document, please send your inquiry to info@almfirst.com.

ALM First

ALM First was founded in 1995 with the focus on financial advisory services for credit union clients.

LinkedIn

  Commentary Disclaimer

ALM First Financial Advisors is an SEC registered investment advisor with a fiduciary duty that requires it to act in the best interests of clients and to place the interests of clients before its own; however, registration as an investment advisor does not imply any level of skill or training. ALM First Financial Advisors, LLC (“ALM First Financial Advisors”), an affiliate of ALM First Group, LLC (“ALM First”), is a separate entity and all investment decisions are made independently by the asset managers at ALM First Financial Advisors. Access to ALM First Financial Advisors is only available to clients pursuant to an Investment Advisory Agreement and acceptance of ALM First Financial Advisors\' Brochure. You are encouraged to read these documents carefully. All investments involve risk and may lose money.

The content in this article is provided for informational purposes and should not be relied upon as recommendations or financial planning advice. We encourage you to seek personalized advice from qualified professionals regarding all personal finance issues. While such information is believed to be reliable, no representation or warranty is made concerning the accuracy of any information presented. Statements herein that reflect projections or expectations of future financial or economic performance are forward-looking statements. Such “forward-looking” statements are based on various assumptions, which assumptions may not prove to be correct. Accordingly, there can be no assurance that such assumptions and statements will accurately predict future events or actual performance. No representation or warranty can be given that the estimates, opinions or assumptions made herein will prove to be accurate. Actual results for any period may or may not approximate such forward-looking statements. No representations or warranties whatsoever are made by ALM First Financial Advisors as to the future profitability of investments recommended by ALM First Financial Advisors.

Moreover, this report was prepared as of the date indicated herein. No representation or warranty is made by ALM First that any of the returns or financial metrics detailed herein will be achieved in the future, as past performance is not a reliable indicator of future results. Certain assumptions may have been made in preparing this material that have resulted in the returns and financial metrics detailed herein. Changes to the assumptions may have a material impact on any returns or financial metrics herein. Furthermore, ALM First gives no representation, warranty or undertaking, or accepts any liability, as to the accuracy or completeness of the information contained this report. This report was prepared for informational purposes only without regard to any particular user’s investment objectives, financial situation, or means, and ALM First is not soliciting any action based upon it. This material is not intended as, nor should it be construed in any way as accounting, tax, legal, or investment advice including within the meaning of Section 975 of the Dodd-Frank Wall Street Reform and Consumer Protection Act. Certain transactions give rise to substantial risk and are not suitable for all investors. The strategies discussed herein can have volatile performance and may employ leverage. Moreover, investment advisory fees and expenses may offset trading gains. This report was prepared by ALM First Financial Advisors, LLC. The hereto mentioned report contains information which is confidential and may also be privileged. It is for the exclusive use of the intended recipient(s). If you are not the intended recipient(s), please note that any distribution, copying, or use of this report or the information contained herein is strictly prohibited. If you have received this report in error, please notify the sender immediately and then destroy any copies of it. ALM First neither owes nor accepts any duty or responsibility to the unauthorized reader. ALM First shall not be liable in respect of any loss, damage, or expense of whatsoever nature which is caused by any use the unauthorized reader may choose to make of this report, or which is otherwise a result of gaining access to the report by the unauthorized reader. This content contains information derived from third-party sources. We believe that this third-party data is reliable; however, we cannot guarantee this data’s currency, accuracy, timeliness, completeness, or fitness for any particular purpose.

INDEX BENCHMARKS: Index performance is discussed for illustrative purposes only as a benchmark for each strategy’s performance and does not predict or depict performance of that strategy. While index comparisons may be useful to provide a benchmark for a strategy’s performance, it must be noted that investments are not limited to the investments comprising the indices. Each of the strategy benchmark indices are unmanaged and cannot be purchased directly by investors.

HYPOTHETICAL PERFORMANCE DISCLAIMERS: Performance figures derived from model portfolios are hypothetical in nature and the results of any individual investor will differ as a result of various factors, including investment limitations relative to model portfolio guidelines, availability of same or similar assets, and fee structures. Investments are presumed to have been made at the beginning of the time period and there are no inflows or outflows of cash during the period. There are limitations and risks associated with the use of model performance or hypothetical performance information, and you should be cautious when looking at any presentation of model or hypothetical performance information. Investment strategies should not be based solely on the use of model or hypothetical information. Actual results will be different from those shown in model or hypothetical performance. The model portfolio returns reflect actual trading including the reinvestment of coupon payments and are net of transaction costs, administrative costs and a strategy-specific per annum fee ranging from 5 bps to 50 bps, which is the amount of the highest fee charged to any ALM First Financial Advisors, LLC customer employing that particular strategy during the period under consideration (the “Model Fee”). Actual fees will vary depending on, among other things, the applicable fee schedule and portfolio size. ALM First\'s fees are available upon request and also may be found in its Form ADV Part 2A. Past performance does not guarantee future results.


Strategic Partners

Let’s Work Together

ALM First is your agile partner with a trusted history of delivering results.