Site Search

Looking for something? Use the search bar below or visit our Resources page.


Author ALM First

Published

Estimated


Economic Update

  • The U.S. economy continues to expand at an above-trend rate, but potential headwinds from trade policies and emerging market stresses are fueling some anxiety in financial markets
  • A stronger dollar and U.S. trade sanctions have brought emerging market risks to the forefront
  • The Fed is poised to hike again in September, but discussions surrounding the neutral rate of interest and alternative risk management tools have picked up in recent weeks

Financial markets continue to digest a myriad of (conflicting) headlines in an effort to formulate an outlook for the remainder of 2018 and beyond. Trade tensions remain a primary concern, although there were some positive developments in August (e.g., the Mexico trade agreement). Emerging markets have exhibited stress signals, which is not necessarily surprising given what has occurred in currency/commodity markets and trade policies. At the same time, the U.S. economy continues to expand at an above-trend rate, buoyed by tax reform and deficit spending. Monetary policy is a wildcard, particularly the perceived determination of the Federal Reserve to continue forward with policy normalization. A September rate hike is all but assured, but will central bank officials change forward guidance and discuss alternative policy tools, such as activating counter-cyclical capital buffers?

On the data front, July consumption data were solid, and business investment continues to push higher. Regarding the latter, nonfinancial corporate profits rose in Q2 at the fastest year-over-year since 2005 on a pre-tax basis. After-tax profits were even more favorable given the effects of tax reform. As a result, business investment, in contributing more positively to overall economic growth, should ultimately lead to greater labor productivity growth assuming historical trends hold.

Trade & Emerging Markets

Markets responded favorably to the announcement of a preliminary bilateral trade agreement between the United States and Mexico on August 27. Most trade-related headlines in 2018 have been negative, so a positive development was well received. Specifics were limited, but it would be a 16-year agreement with a review every six years. There is a particular focus on the auto sector, including an obligation for car companies to manufacture at least 75% of an automobile’s value in North America, up from the current requirement of 62.5%. The ultimate goal is to roll this deal into a trilateral agreement that would include Canada (NAFTA 2.0), but those negotiations are ongoing. Given the current presidential transition in Mexico, the earliest that this agreement could be formalized and approved is likely in 2019.

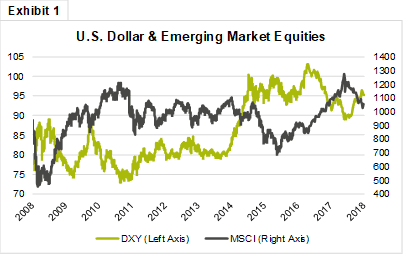
While the last week of August started off well with the Mexico agreement, a risk-off theme returned toward the end of the week on further emerging markets concerns and reports that President Trump was prepared to move forward with 25% tariffs on another $200 billion of Chinese goods as early as this week. Regarding emerging markets, Turkey and Argentina have been on the forefront of recent stress, but current risks are more broad across the entire space. Total emerging-market debt has increased form $21 trillion in 2007 (145% of GDP) to $63 trillion (210% of GDP) in 2017, and foreign-currency debt (denominated in dollars, euros, and yen) has doubled to $9 trillion over that same timeframe. Many of these countries have inadequate foreign-currency reserves to cover short-term debt maturities and long-term debt amortization, which requires new debt issuance to cover funding gaps. With the U.S. dollar rallying, this makes foreign-currency debt more expensive, and at the same time, lower expected returns have reduced demand from private institutional investors for local-currency debt. In the graph below, the MSCI Emerging Markets Index (equities) is plotted versus the U.S. dollar index (DXY) over the last 10 years. As the DXY increases, the MSCI typically falls, and vice versa.

The withdrawal of capital from private investors further weakens emerging currencies and devalues asset valuations, and as a result, stress in local banking and credit downgrades typically follow. Emerging market countries can respond by ratcheting up interest rates, which reduces growth and makes the debt burden worse, and if they don’t, weaker currencies effectively import inflation. These countries also typically rely heavily on commodity exports, and commodity prices have fallen in recent months amid a stronger U.S. dollar (the world’s reserve currency for trade). It can be a viscous cycle, and these stresses have been building over the last decade amid vast liquidity and low interest rates coinciding with the ultra-accommodative policies of the world’s largest central banks. As that liquidity is withdrawn, emerging market economies are on the front lines and are the likely first casualties. We haven’t seen a major emerging markets calamity since the 1997 Asian crisis, but analysts and economists are closely watching the current scenario for signs of the next major market event.

Fed Update

The Treasury curve has flattened to current-cycle lows using virtually every slope metric. The 2-year/10-year spread touched 18 bps on August 27th, and the same metric one-year forward was just 10 bps on that day. Many have questioned whether the Fed will continue with current rate hike projections given current yield curve dynamics. A September hike is all but a done deal, and a December hike is looking more certain as well barring any unexpected economic/market shocks. The bigger question is what will come in 2019 for monetary policy: how will the Fed shift its guidance with regards to the natural (or neutral) rate of interest, commonly referred to as R*? Maintaining positive yield curve slope is not one of the Fed’s mandates, and as noted in this commentary on several occasions, an inverted yield curve during a Fed tightening cycle is more the rule, not the exception, in modern history.

The trick, of course, is in determining R*, which is easier to define in the rear-view mirror than it is in a real-time decision-making framework…


To continue reading this month’s market commentary, and to learn more about current market themes, market sectors, sector performances, and applied strategies, log in to the ALM First portal, and select this month’s commentary in the Resource Center.

ALM First

ALM First was founded in 1995 with the focus on financial advisory services for credit union clients.

LinkedIn

  Commentary Disclaimer

ALM First Financial Advisors is an SEC registered investment advisor with a fiduciary duty that requires it to act in the best interests of clients and to place the interests of clients before its own; however, registration as an investment advisor does not imply any level of skill or training. ALM First Financial Advisors, LLC (“ALM First Financial Advisors”), an affiliate of ALM First Group, LLC (“ALM First”), is a separate entity and all investment decisions are made independently by the asset managers at ALM First Financial Advisors. Access to ALM First Financial Advisors is only available to clients pursuant to an Investment Advisory Agreement and acceptance of ALM First Financial Advisors\' Brochure. You are encouraged to read these documents carefully. All investments involve risk and may lose money.

The content in this article is provided for informational purposes and should not be relied upon as recommendations or financial planning advice. We encourage you to seek personalized advice from qualified professionals regarding all personal finance issues. While such information is believed to be reliable, no representation or warranty is made concerning the accuracy of any information presented. Statements herein that reflect projections or expectations of future financial or economic performance are forward-looking statements. Such “forward-looking” statements are based on various assumptions, which assumptions may not prove to be correct. Accordingly, there can be no assurance that such assumptions and statements will accurately predict future events or actual performance. No representation or warranty can be given that the estimates, opinions or assumptions made herein will prove to be accurate. Actual results for any period may or may not approximate such forward-looking statements. No representations or warranties whatsoever are made by ALM First Financial Advisors as to the future profitability of investments recommended by ALM First Financial Advisors.

Moreover, this report was prepared as of the date indicated herein. No representation or warranty is made by ALM First that any of the returns or financial metrics detailed herein will be achieved in the future, as past performance is not a reliable indicator of future results. Certain assumptions may have been made in preparing this material that have resulted in the returns and financial metrics detailed herein. Changes to the assumptions may have a material impact on any returns or financial metrics herein. Furthermore, ALM First gives no representation, warranty or undertaking, or accepts any liability, as to the accuracy or completeness of the information contained this report. This report was prepared for informational purposes only without regard to any particular user’s investment objectives, financial situation, or means, and ALM First is not soliciting any action based upon it. This material is not intended as, nor should it be construed in any way as accounting, tax, legal, or investment advice including within the meaning of Section 975 of the Dodd-Frank Wall Street Reform and Consumer Protection Act. Certain transactions give rise to substantial risk and are not suitable for all investors. The strategies discussed herein can have volatile performance and may employ leverage. Moreover, investment advisory fees and expenses may offset trading gains. This report was prepared by ALM First Financial Advisors, LLC. The hereto mentioned report contains information which is confidential and may also be privileged. It is for the exclusive use of the intended recipient(s). If you are not the intended recipient(s), please note that any distribution, copying, or use of this report or the information contained herein is strictly prohibited. If you have received this report in error, please notify the sender immediately and then destroy any copies of it. ALM First neither owes nor accepts any duty or responsibility to the unauthorized reader. ALM First shall not be liable in respect of any loss, damage, or expense of whatsoever nature which is caused by any use the unauthorized reader may choose to make of this report, or which is otherwise a result of gaining access to the report by the unauthorized reader. This content contains information derived from third-party sources. We believe that this third-party data is reliable; however, we cannot guarantee this data’s currency, accuracy, timeliness, completeness, or fitness for any particular purpose.

INDEX BENCHMARKS: Index performance is discussed for illustrative purposes only as a benchmark for each strategy’s performance and does not predict or depict performance of that strategy. While index comparisons may be useful to provide a benchmark for a strategy’s performance, it must be noted that investments are not limited to the investments comprising the indices. Each of the strategy benchmark indices are unmanaged and cannot be purchased directly by investors.

HYPOTHETICAL PERFORMANCE DISCLAIMERS: Performance figures derived from model portfolios are hypothetical in nature and the results of any individual investor will differ as a result of various factors, including investment limitations relative to model portfolio guidelines, availability of same or similar assets, and fee structures. Investments are presumed to have been made at the beginning of the time period and there are no inflows or outflows of cash during the period. There are limitations and risks associated with the use of model performance or hypothetical performance information, and you should be cautious when looking at any presentation of model or hypothetical performance information. Investment strategies should not be based solely on the use of model or hypothetical information. Actual results will be different from those shown in model or hypothetical performance. The model portfolio returns reflect actual trading including the reinvestment of coupon payments and are net of transaction costs, administrative costs and a strategy-specific per annum fee ranging from 5 bps to 50 bps, which is the amount of the highest fee charged to any ALM First Financial Advisors, LLC customer employing that particular strategy during the period under consideration (the “Model Fee”). Actual fees will vary depending on, among other things, the applicable fee schedule and portfolio size. ALM First\'s fees are available upon request and also may be found in its Form ADV Part 2A. Past performance does not guarantee future results.


Strategic Partners

Let’s Work Together

ALM First is your agile partner with a trusted history of delivering results.
