
Originally published by CU Business.
Just over 6 years ago, the National Credit Union Administration (NCUA) announced key changes to interest rate risk supervision during its June 16, 2016 board meeting, which included the rollout of the Net Economic Value (NEV) Supervisory Test.
Developed to help identify potential instances of unsafe and unsound risk exposure within the industry, the test has become a mainstay of the regulatory interest rate risk measurement process, and we run hundreds of these tests each quarter at ALM First to help credit union clients monitor the assessment’s results and prepare for examinations.
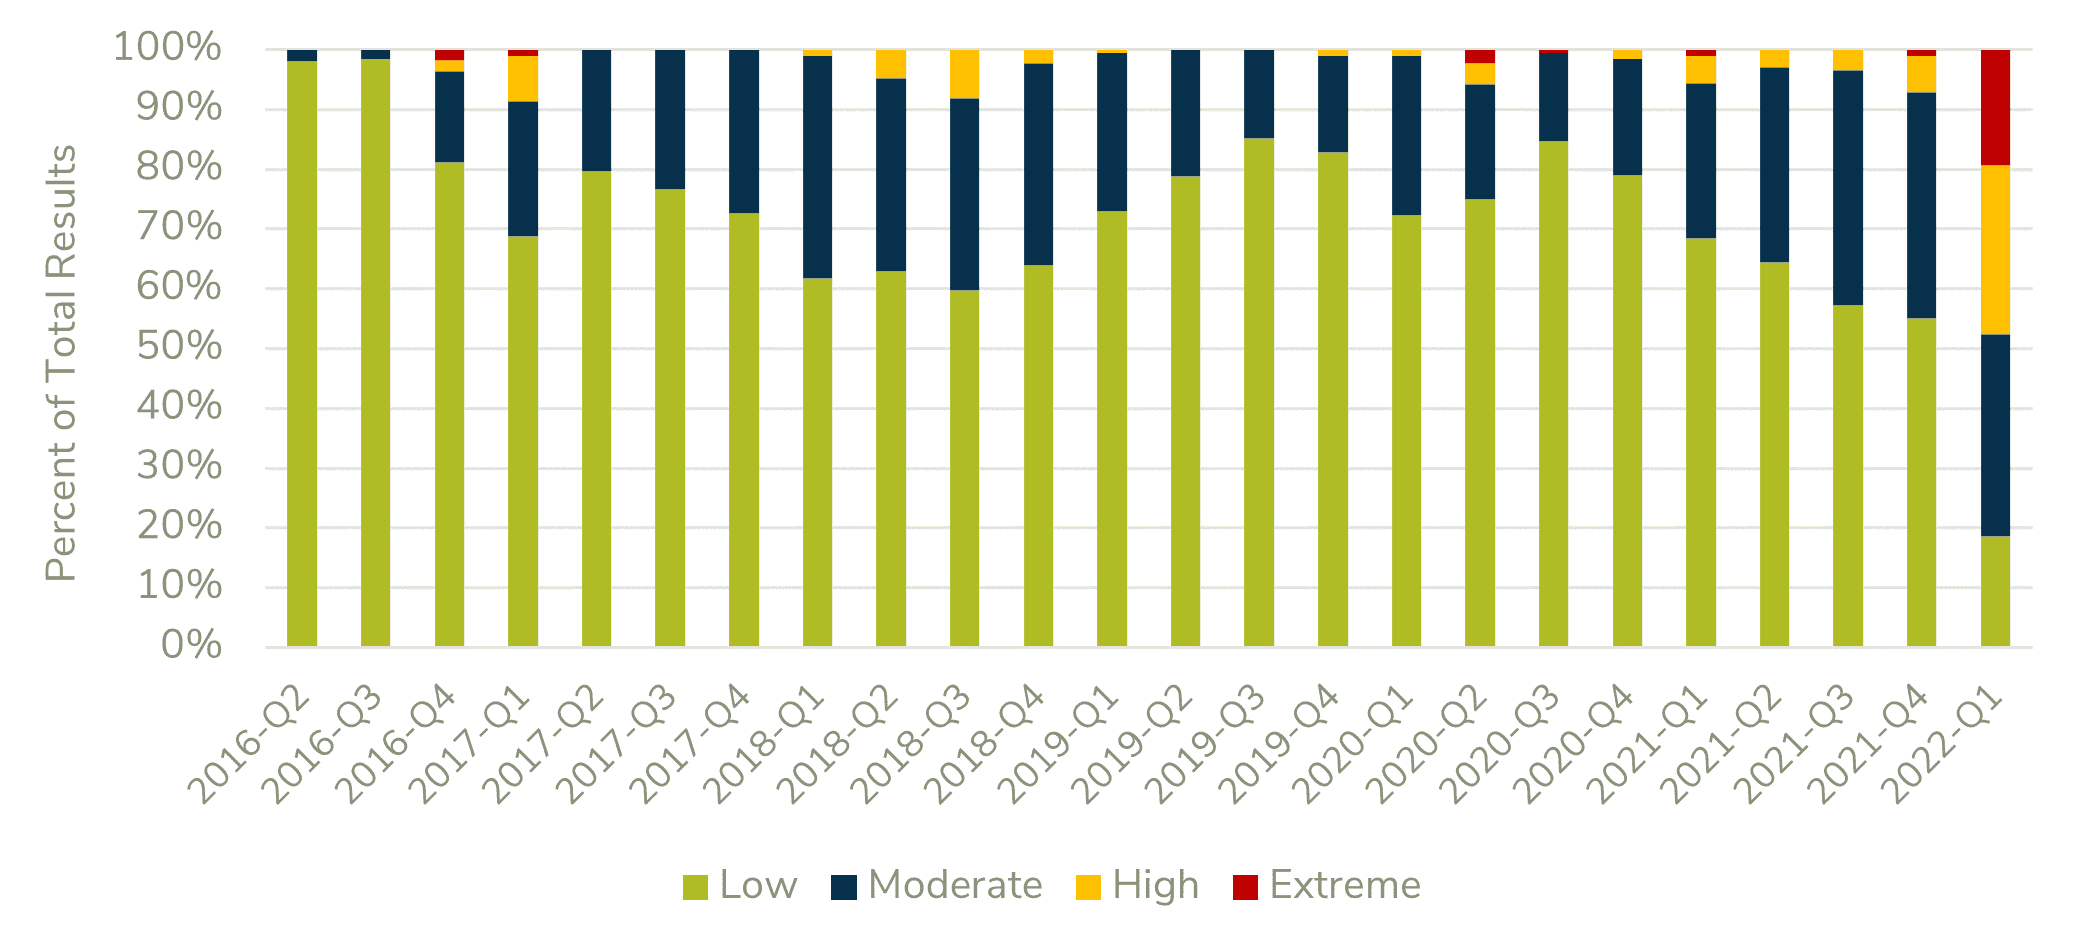
For ALM practitioners familiar with the design of the test, the recent trend of test results comes as no surprise. The first quarter of 2022 saw a significant rise in the level of risk indicated by this test, as evident in our historical results (Figure 1), which shows the frequency of the four risk category results. While the test results have been trending worse for some time, they have worsened substantially from Q4 2021 to Q1 2022 as interest rates increased substantially (between 50 and 150 basis points depending on curve tenor). According to our data as of Q1 2022, the High and Extreme categories represent nearly 50% of all test results.
Figure 1: Frequency of NEV Supervisory Test Results
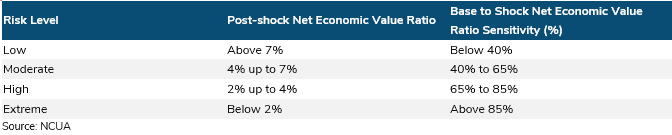
For those less familiar with the mechanics of the assessment tool, let’s define the NCUA’s NEV Supervisory Test in greater detail. The NCUA NEV Supervisory Test is an NEV sensitivity measurement using standardized values for non-maturity deposits (NMDs) in lieu of the credit union’s applied fair values; the fair values for all other accounts are left unchanged (e.g., loans, investments, term deposits). The resulting balance sheet sensitivity is categorized as shown in Figure 2 using the shocked NEV Percent Change and NEV Ratio in the +300 basis point scenario.
Figure 2: NEV Supervisory Test Risk Result
As outlined in this NCUA fact sheet, the test was developed in response to the significant degree of uncertainty surrounding the valuation of NMDs and the desire to create a cross-comparable standardized treatment. The treatment uses a 99.00 price in the base scenario (1% benefit to economic value) and a 95.04 price in the +300 basis point scenario (a 4 percent decline from base) for NMD valuations.
The test was initially calibrated using deposit-study data from hundreds of credit unions. The 1 percent base value indicates a deposit franchise premium benefit, which was observed from the dataset. The mean and median values were used to initially calibrate the base price but were not indexed to adjust for changes in market conditions.
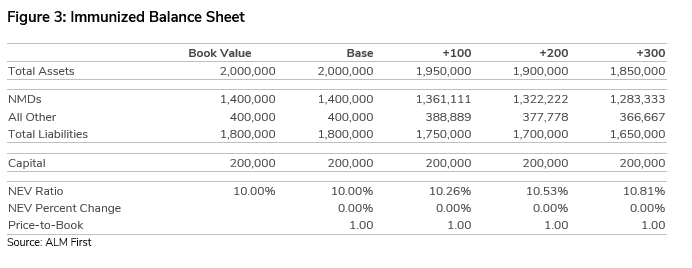
The non-indexed NMD values (set to 99.00 in each quarterly test) represent an important factor in the increasing frequency of High/Extreme risk results. Consider a hypothetical example to illustrate this concept: a perfectly balanced asset-liability (AL) profile, meaning the economic value (EV) of equity is immunized to changes in interest rates, as shown in Figure 3. Note as EV of equity remains stable, the NEV Ratio increases due to falling asset values from higher discounting rates.
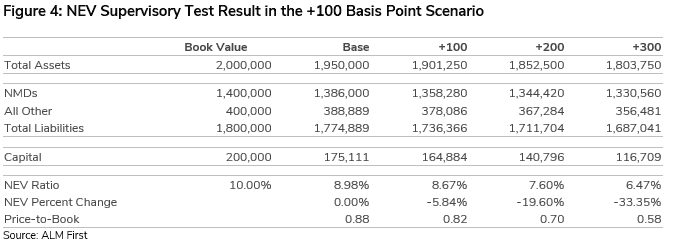
This balance sheet’s NEV Supervisory Test result would be in the Low category: 8.26% post-shock NEV ratio and -28.61% NEV Percent Change. Now, if we assume a +100 basis point scenario happens and use the +100 scenario values as the base to rerun the Supervisory Test, as seen in Figure 4, the result becomes Moderate: 6.47% post-shock NEV ratio and -33.35% NEV Percent Change. As shown, the interest rate risk of the hypothetical entity was actually improved by higher rates, but the increased test risk result stems from the lower asset value in the base (from higher discount rates).
Of course, the impact of higher rates is dependent on the asset duration, defined as sensitivity of fair value to changes in interest rates. We used 2.50% in this example. Institutions with lower asset duration are much more resilient to a deteriorating test result from higher interest rates, as seen in Figure 5. Using a 1% asset duration and a 10% capital ratio, the test results in Low in even a +300 basis point rate shock. On the other hand, a 4% asset duration, while having a Moderate result in the base, becomes Extreme in just the +100 scenario.
Figure 5: NEV Supervisory Test Results by Asset Duration and Rate Shock
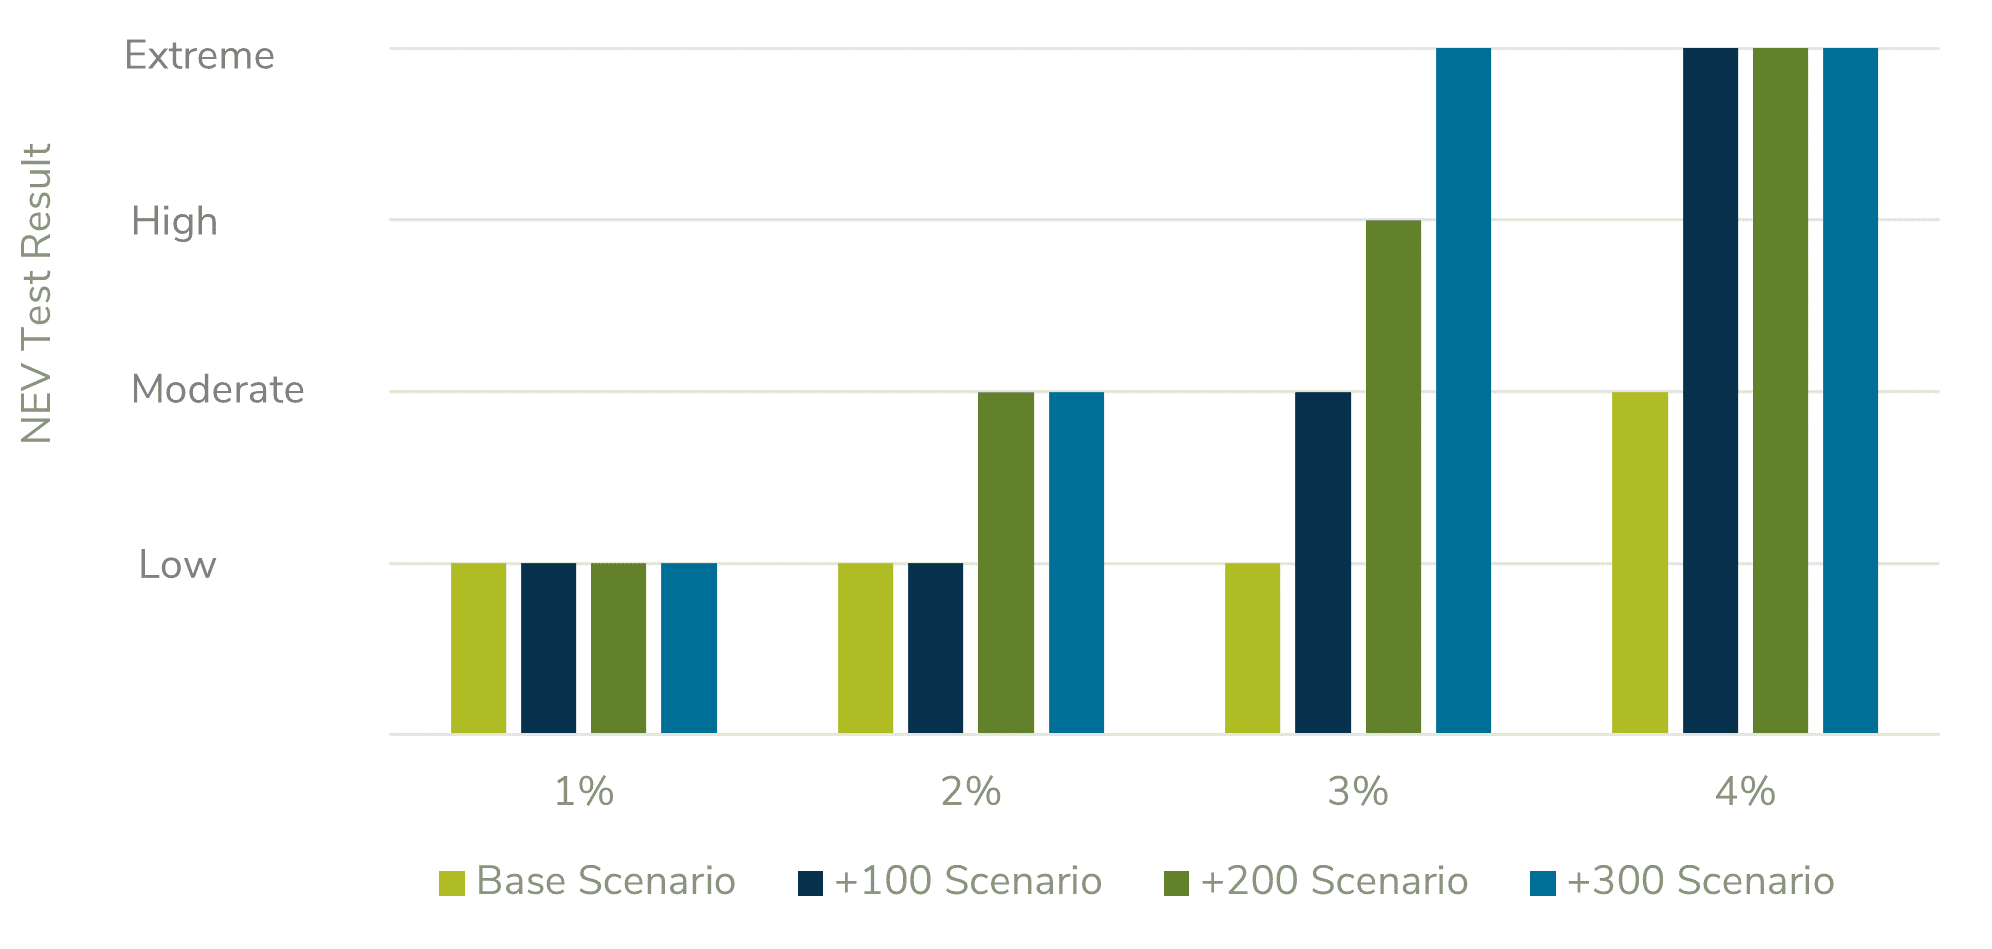
With High/Extreme results now occurring nearly 50% if the time, the question of whether recalibration is warranted has become very timely. In the NCUA’s initial fact sheet, the administration mentioned that it expected to review the NEV Supervisory Test “over time to address changes in market conditions and potential shifts in credit union risk profiles,” and “assess the risk classifications for low, moderate, high, and extreme interest rate risk to ensure appropriate measurement values.”
It remains to be seen how the NCUA responds and what supervisory actions are taken during examinations. While a document of resolution (DOR) would still be expected for an Extreme result at this time, the required response and actions taken could be passive in nature, giving reference to the current market rate environment and organic growth plans through retained earnings. It will be important to recognize the extent to which an Extreme or High result is caused by external factors versus risk management and governance. In other words, the “appropriate de-risking actions” should be in the context of overall balance sheet risk. This is an important nuance.
Credit unions that find themselves in the Extreme category and between examination cycles are encouraged to reach out to their federal or state regulator to discuss reasons for the increased risk position and action plans to address risk exposure. A proactive approach could mitigate supervisory concerns and potential supervisory findings from an examination.
Overall, several important factors have contributed to a substantial increase in High and Extreme results. Along with rapidly increasing interest rates, these include a decade-low net worth ratio level for the credit union industry and similar highs in NMD portion of total funding. However, the focus on sensible risk management must be maintained, which would include adherence to internal risk limits and independent evaluation of financial performance.
Want to input your own NEV parameters to explore the impacts of a rate shock? Contact us about the Excel tool that we’ve created for your reference.
This content contains information derived from third-party sources. We believe that this third-party data is reliable; however, we cannot guarantee this data’s currency, accuracy, timeliness, completeness, or fitness for any particular purpose.
